제품 환경에 작업 프로세스와 대기열을 모니터링하기 위해 Prometheus와 같은 모니터링 도구를 사용하는 것을 권장합니다.
대기열 지표
Web UI를 사용하는 경우 다음 두 매개변수를 제공하여 Prometheus와 통합을 활성화할 수 있습니다:
--enable-metrics-exporter: 대기열 지표를 수집하여/metrics엔드포인트에 내보냅니다.--prometheus-addr: Web UI 내에서 대기열 지표를 시각화합니다.
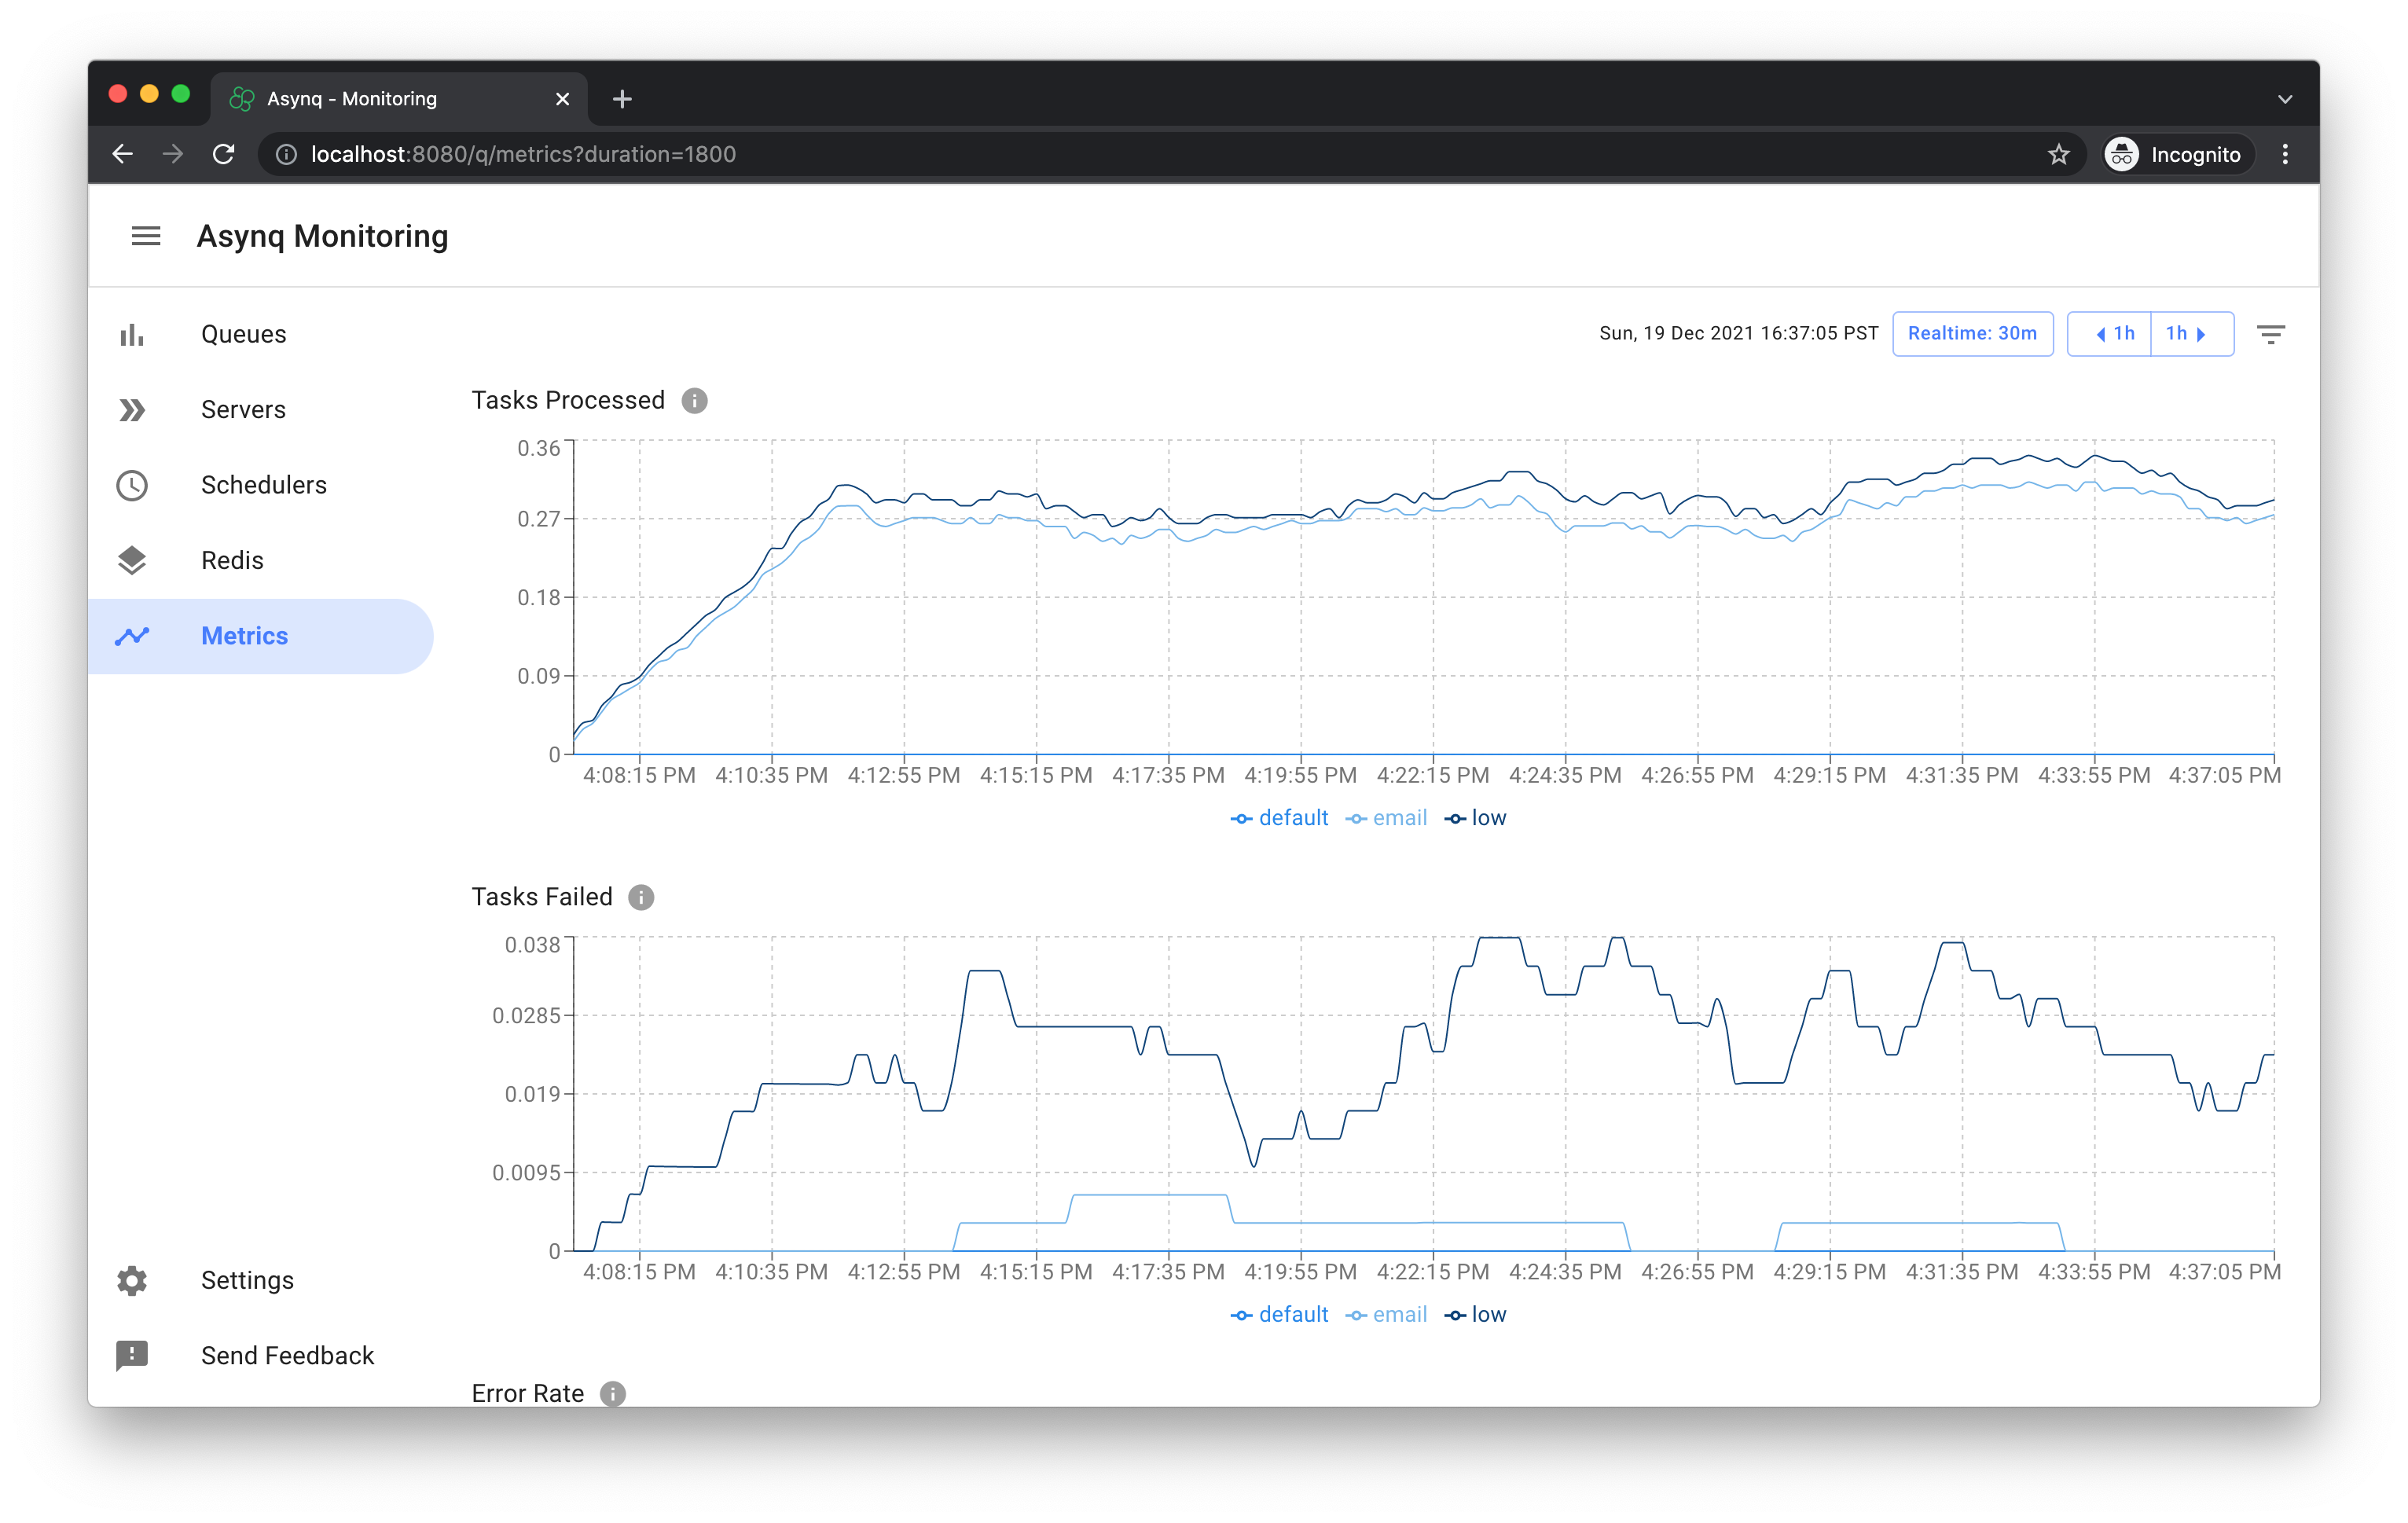
대기열 지표 페이지는 다음과 같습니다:
Web UI를 사용하지 않는 경우 Asynq에는 대기열 지표를 내보내는 데 사용할 수 있는 바이너리 파일이 함께 제공됩니다. 또한 대기열 지표를 수집하는 x/metrics 패키지도 포함되어 있습니다.
작업 프로세스 지표
Asynq Handler 인터페이스와 ServeMux는 가시성을 위해 지표를 삽입할 수 있습니다.
다음은 Prometheus를 사용하여 작업 프로세스 지표를 내보내는 예시입니다. 우리는 애플리케이션 내에서 코드를 삽입하여 Prometheus가 추적하는 기본 지표(메모리 및 CPU와 같은) 외에도 추가 애플리케이션별 지표를 추적할 수 있습니다.
예시 코드에서 추적하는 애플리케이션별 지표 목록은 다음과 같습니다:
- 작업 프로세스에서 처리된 작업의 총 수(성공 및 실패한 작업 모두 포함).
- 작업 프로세스에서 처리된 실패한 작업의 수.
- 작업 프로세스에서 현재 처리 중인 작업의 수.
package main

import (
    "context"
    "log"
    "net/http"
    "os"
    "os/signal"
    "runtime"

    "github.com/hibiken/asynq"
    "github.com/hibiken/asynq/examples/tasks"
    "github.com/prometheus/client_golang/prometheus"
    "github.com/prometheus/client_golang/prometheus/promauto"
    "github.com/prometheus/client_golang/prometheus/promhttp"
    "golang.org/x/sys/unix"
)

// 지표 변수.
var (
    processedCounter = promauto.NewCounterVec(
        prometheus.CounterOpts{
            Name: "processed_tasks_total",
            Help: "처리된 작업의 총 수",
        },
        []string{"task_type"},
    )

    failedCounter = promauto.NewCounterVec(
        prometheus.CounterOpts{
            Name: "failed_tasks_total",
            Help: "처리된 실패한 작업의 총 수",
        },
        []string{"task_type"},
    )

    inProgressGauge = promauto.NewGaugeVec(
        prometheus.GaugeOpts{
            Name: "in_progress_tasks",
            Help: "현재 처리 중인 작업의 수",
        },
        []string{"task_type"},
    )
)

func metricsMiddleware(next asynq.Handler) asynq.Handler {
    return asynq.HandlerFunc(func(ctx context.Context, t *asynq.Task) error {
        inProgressGauge.WithLabelValues(t.Type()).Inc()
        err := next.ProcessTask(ctx, t)
        inProgressGauge.WithLabelValues(t.Type()).Dec()
        if err != nil {
            failedCounter.WithLabelValues(t.Type()).Inc()
        }
        processedCounter.WithLabelValues(t.Type()).Inc()
        return err
    })
}

func main() {
    httpServeMux := http.NewServeMux()
    httpServeMux.Handle("/metrics", promhttp.Handler())
    metricsSrv := &http.Server{
        Addr:    ":2112",
        Handler: httpServeMux,
    }
    done := make(chan struct{})

    // 지표 서버 시작.
    go func() {
        err := metricsSrv.ListenAndServe()
        if err != nil && err != http.ErrServerClosed {
            log.Printf("오류: 지표 서버에서 오류 발생: %v", err)
        }
        close(done)
    }()

    srv := asynq.NewServer(
        asynq.RedisClientOpt{Addr: ":6379"},
        asynq.Config{Concurrency: 20},
    )

    mux := asynq.NewServeMux()
    mux.Use(metricsMiddleware)
    mux.HandleFunc(tasks.TypeEmail, tasks.HandleEmailTask)

    // 워커 서버 시작.
    if err := srv.Start(mux); err != nil {
        log.Fatalf("워커 서버 시작 실패: %v", err)
    }

    // 종료 신호 기다림.
    sigs := make(chan os.Signal, 1)
    signal.Notify(sigs, unix.SIGTERM, unix.SIGINT)
}