We recommend using monitoring tools such as Prometheus to monitor your job processes and queues in the production environment.
Queue Metrics
If you are using Web UI, you can enable integration with Prometheus by providing two parameters:
-
--enable-metrics-exporter: Enable the collection of queue metrics and export them to the/metricsendpoint. -
--prometheus-addr: Enable visualization of queue metrics within the Web UI.
The queue metrics page looks like this:
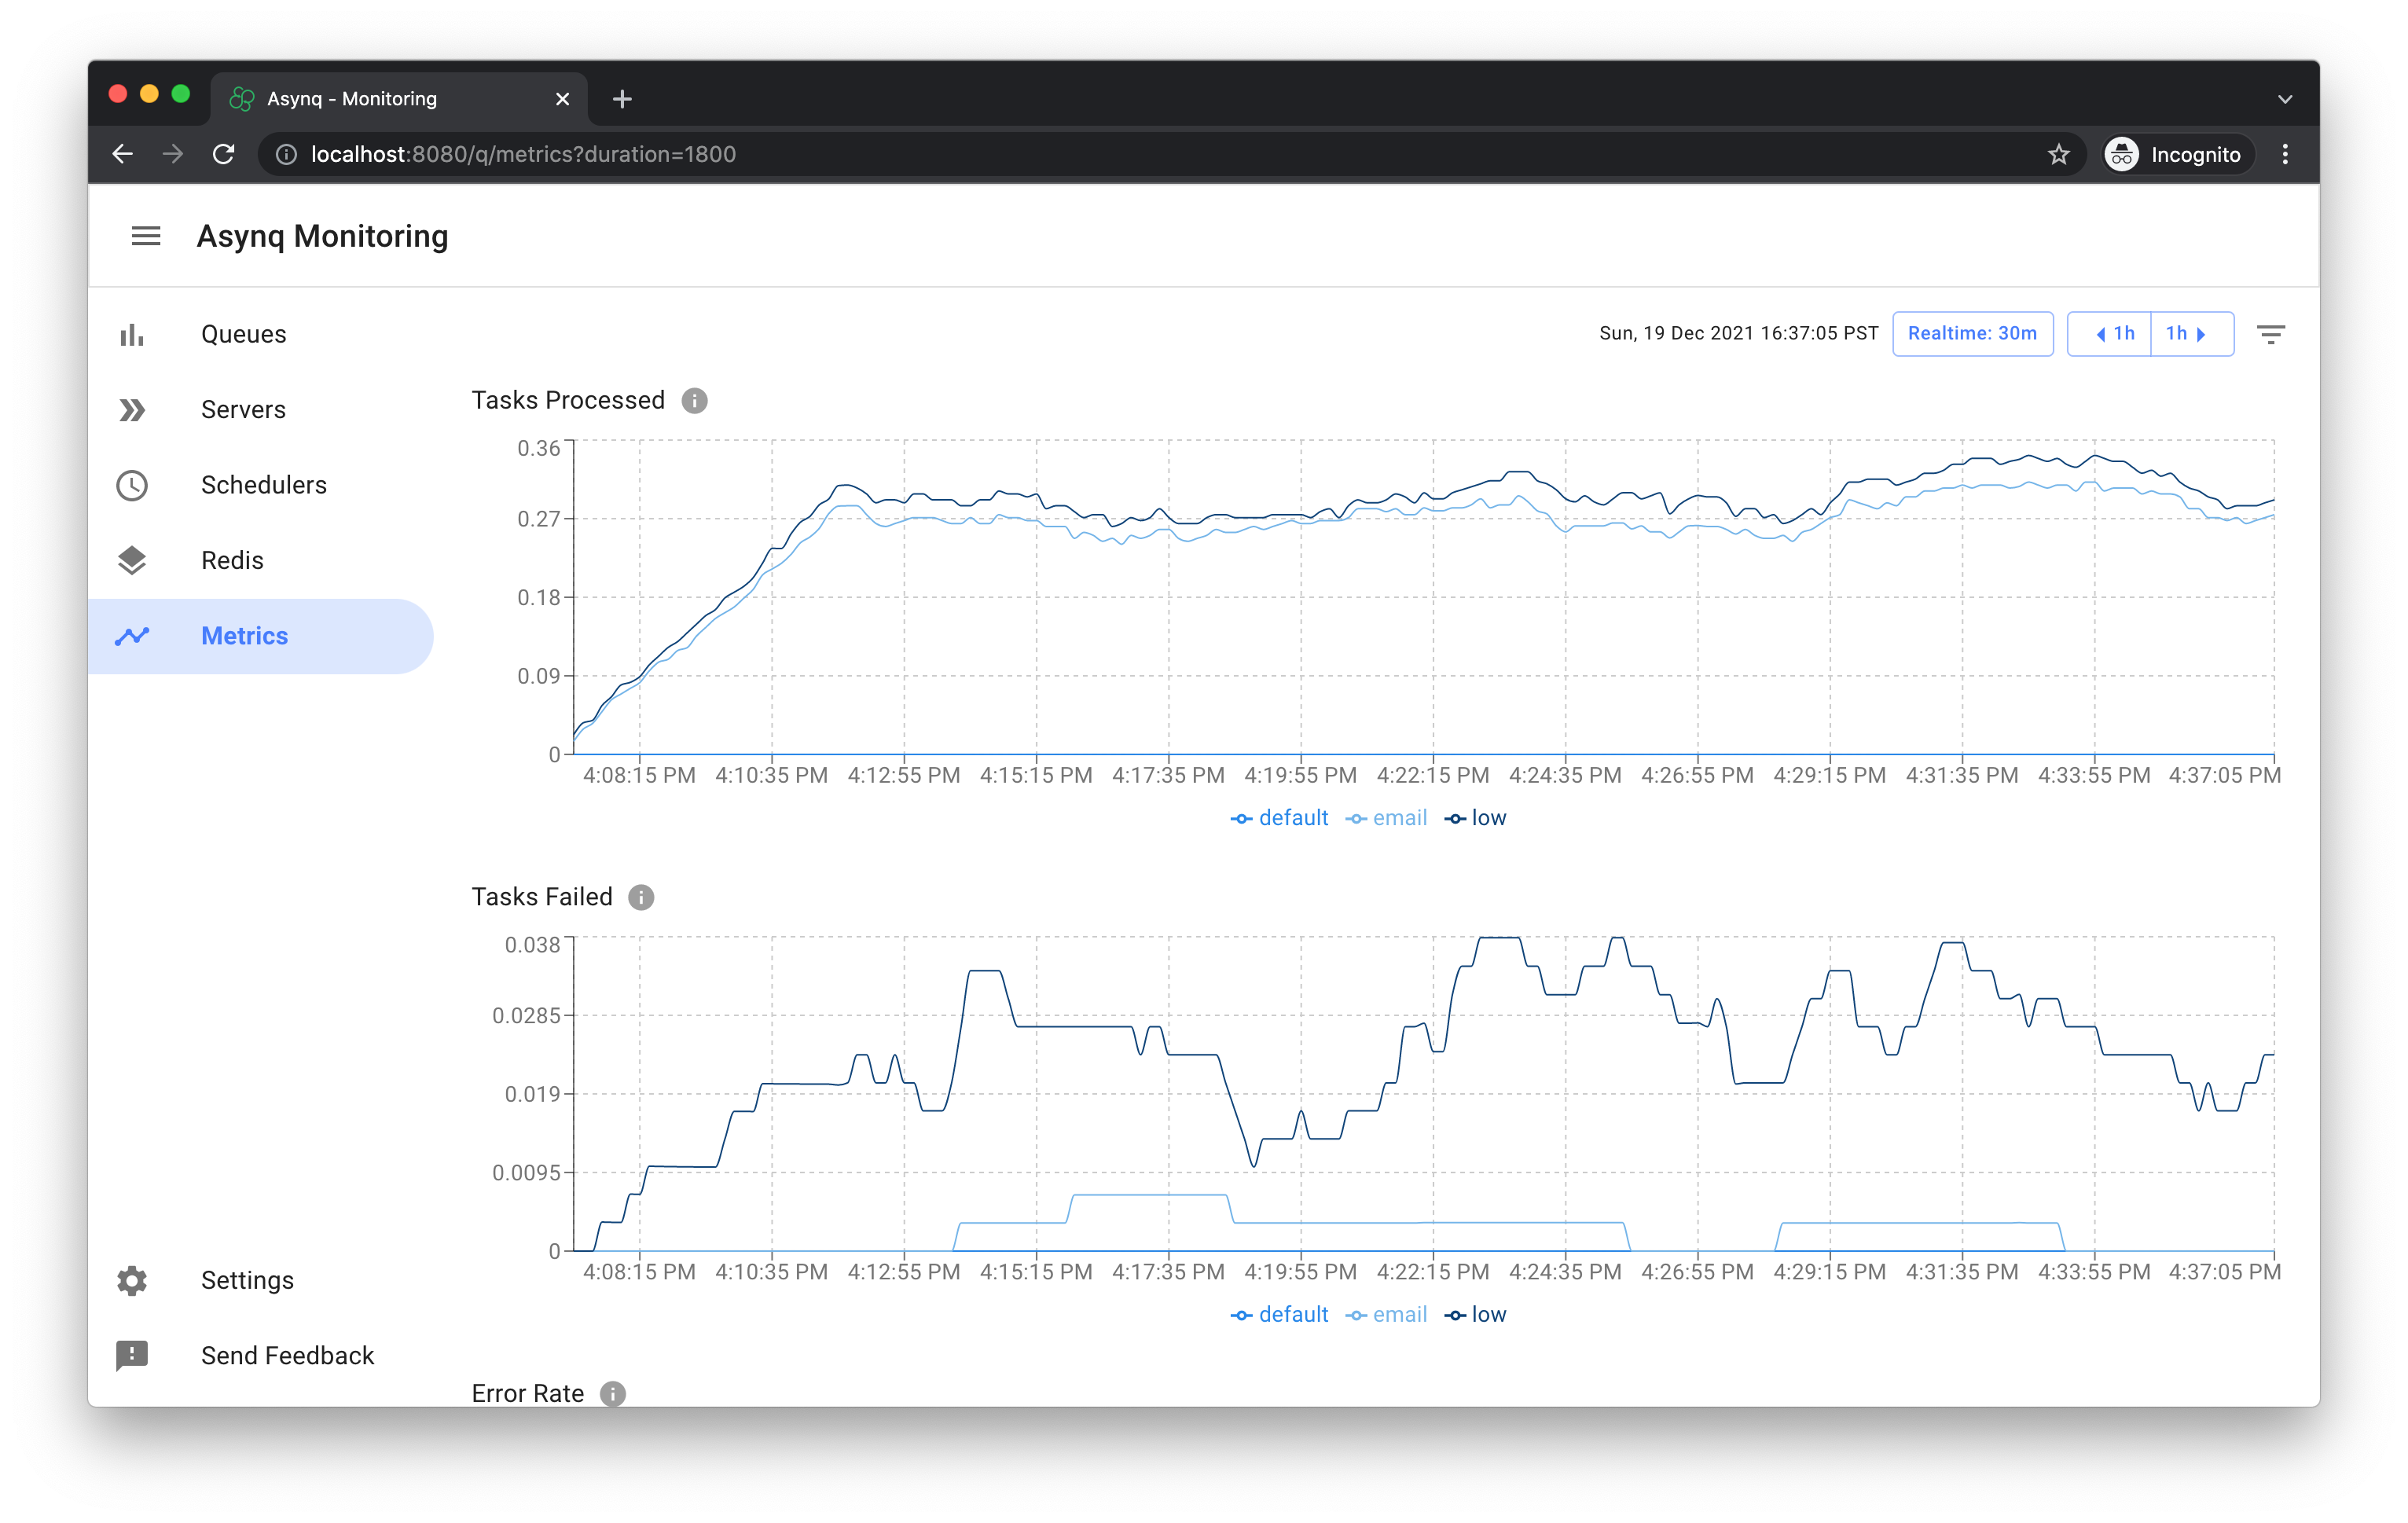
If you are not using the Web UI, Asynq comes with a binary file that you can run to export queue metrics. It also includes a package x/metrics for collecting queue metrics.
Job Process Metrics
The Asynq Handler interface and ServeMux can be instrumented with metrics for observability.
Here is an example of exporting job process metrics using Prometheus. We can instrument our code within the application to track additional application-specific metrics, as well as default metrics (such as memory and CPU) tracked by Prometheus.
Here is a list of application-specific metrics tracked in the example code:
- The total number of tasks processed by the job process (including both successful and failed tasks).
- The number of failed tasks processed by the job process.
- The current number of tasks being processed by the job process.
package main

import (
    "context"
    "log"
    "net/http"
    "os"
    "os/signal"
    "runtime"

    "github.com/hibiken/asynq"
    "github.com/hibiken/asynq/examples/tasks"
    "github.com/prometheus/client_golang/prometheus"
    "github.com/prometheus/client_golang/prometheus/promauto"
    "github.com/prometheus/client_golang/prometheus/promhttp"
    "golang.org/x/sys/unix"
)

// Metric variables.
var (
    processedCounter = promauto.NewCounterVec(
        prometheus.CounterOpts{
            Name: "processed_tasks_total",
            Help: "Total number of processed tasks",
        },
        []string{"task_type"},
    )

    failedCounter = promauto.NewCounterVec(
        prometheus.CounterOpts{
            Name: "failed_tasks_total",
            Help: "Total number of failed tasks processed",
        },
        []string{"task_type"},
    )

    inProgressGauge = promauto.NewGaugeVec(
        prometheus.GaugeOpts{
            Name: "in_progress_tasks",
            Help: "Current number of tasks being processed",
        },
        []string{"task_type"},
    )
)

func metricsMiddleware(next asynq.Handler) asynq.Handler {
    return asynq.HandlerFunc(func(ctx context.Context, t *asynq.Task) error {
        inProgressGauge.WithLabelValues(t.Type()).Inc()
        err := next.ProcessTask(ctx, t)
        inProgressGauge.WithLabelValues(t.Type()).Dec()
        if err != nil {
            failedCounter.WithLabelValues(t.Type()).Inc()
        }
        processedCounter.WithLabelValues(t.Type()).Inc()
        return err
    })
}

func main() {
    httpServeMux := http.NewServeMux()
    httpServeMux.Handle("/metrics", promhttp.Handler())
    metricsSrv := &http.Server{
        Addr:    ":2112",
        Handler: httpServeMux,
    }
    done := make(chan struct{})

    // Start the metrics server.
    go func() {
        err := metricsSrv.ListenAndServe()
        if err != nil && err != http.ErrServerClosed {
            log.Printf("Error: metrics server errored: %v", err)
        }
        close(done)
    }()

    srv := asynq.NewServer(
        asynq.RedisClientOpt{Addr: ":6379"},
        asynq.Config{Concurrency: 20},
    )

    mux := asynq.NewServeMux()
    mux.Use(metricsMiddleware)
    mux.HandleFunc(tasks.TypeEmail, tasks.HandleEmailTask)

    // Start the worker server.
    if err := srv.Start(mux); err != nil {
        log.Fatalf("Failed to start worker server: %v", err)
    }

    // Wait for termination signals.
    sigs := make(chan os.Signal, 1)
    signal.Notify(sigs, unix.SIGTERM, unix.SIGINT)
}