เราขอแนะนำให้ใช้เครื่องมือตรวจสอบอย่าง Prometheus เพื่อตรวจสอบกระบวนการงานและคิวของงานของคุณในสภาพแวดล้อมการผลิต
คิวแมตริก
หากคุณใช้ หน้าจอ UI คุณสามารถเปิดการใช้งานการผสานกับ Prometheus โดยการระบุพารามิเตอร์สองตัวดังนี้:
-
--enable-metrics-exporter: เปิดการเก็บรวบรวมคิวแมตริกและส่งออกไปยังจุดปลายทาง/metrics. -
--prometheus-addr: เปิดการแสดงออกคิวแมตริกภายในหน้าจอ UI.
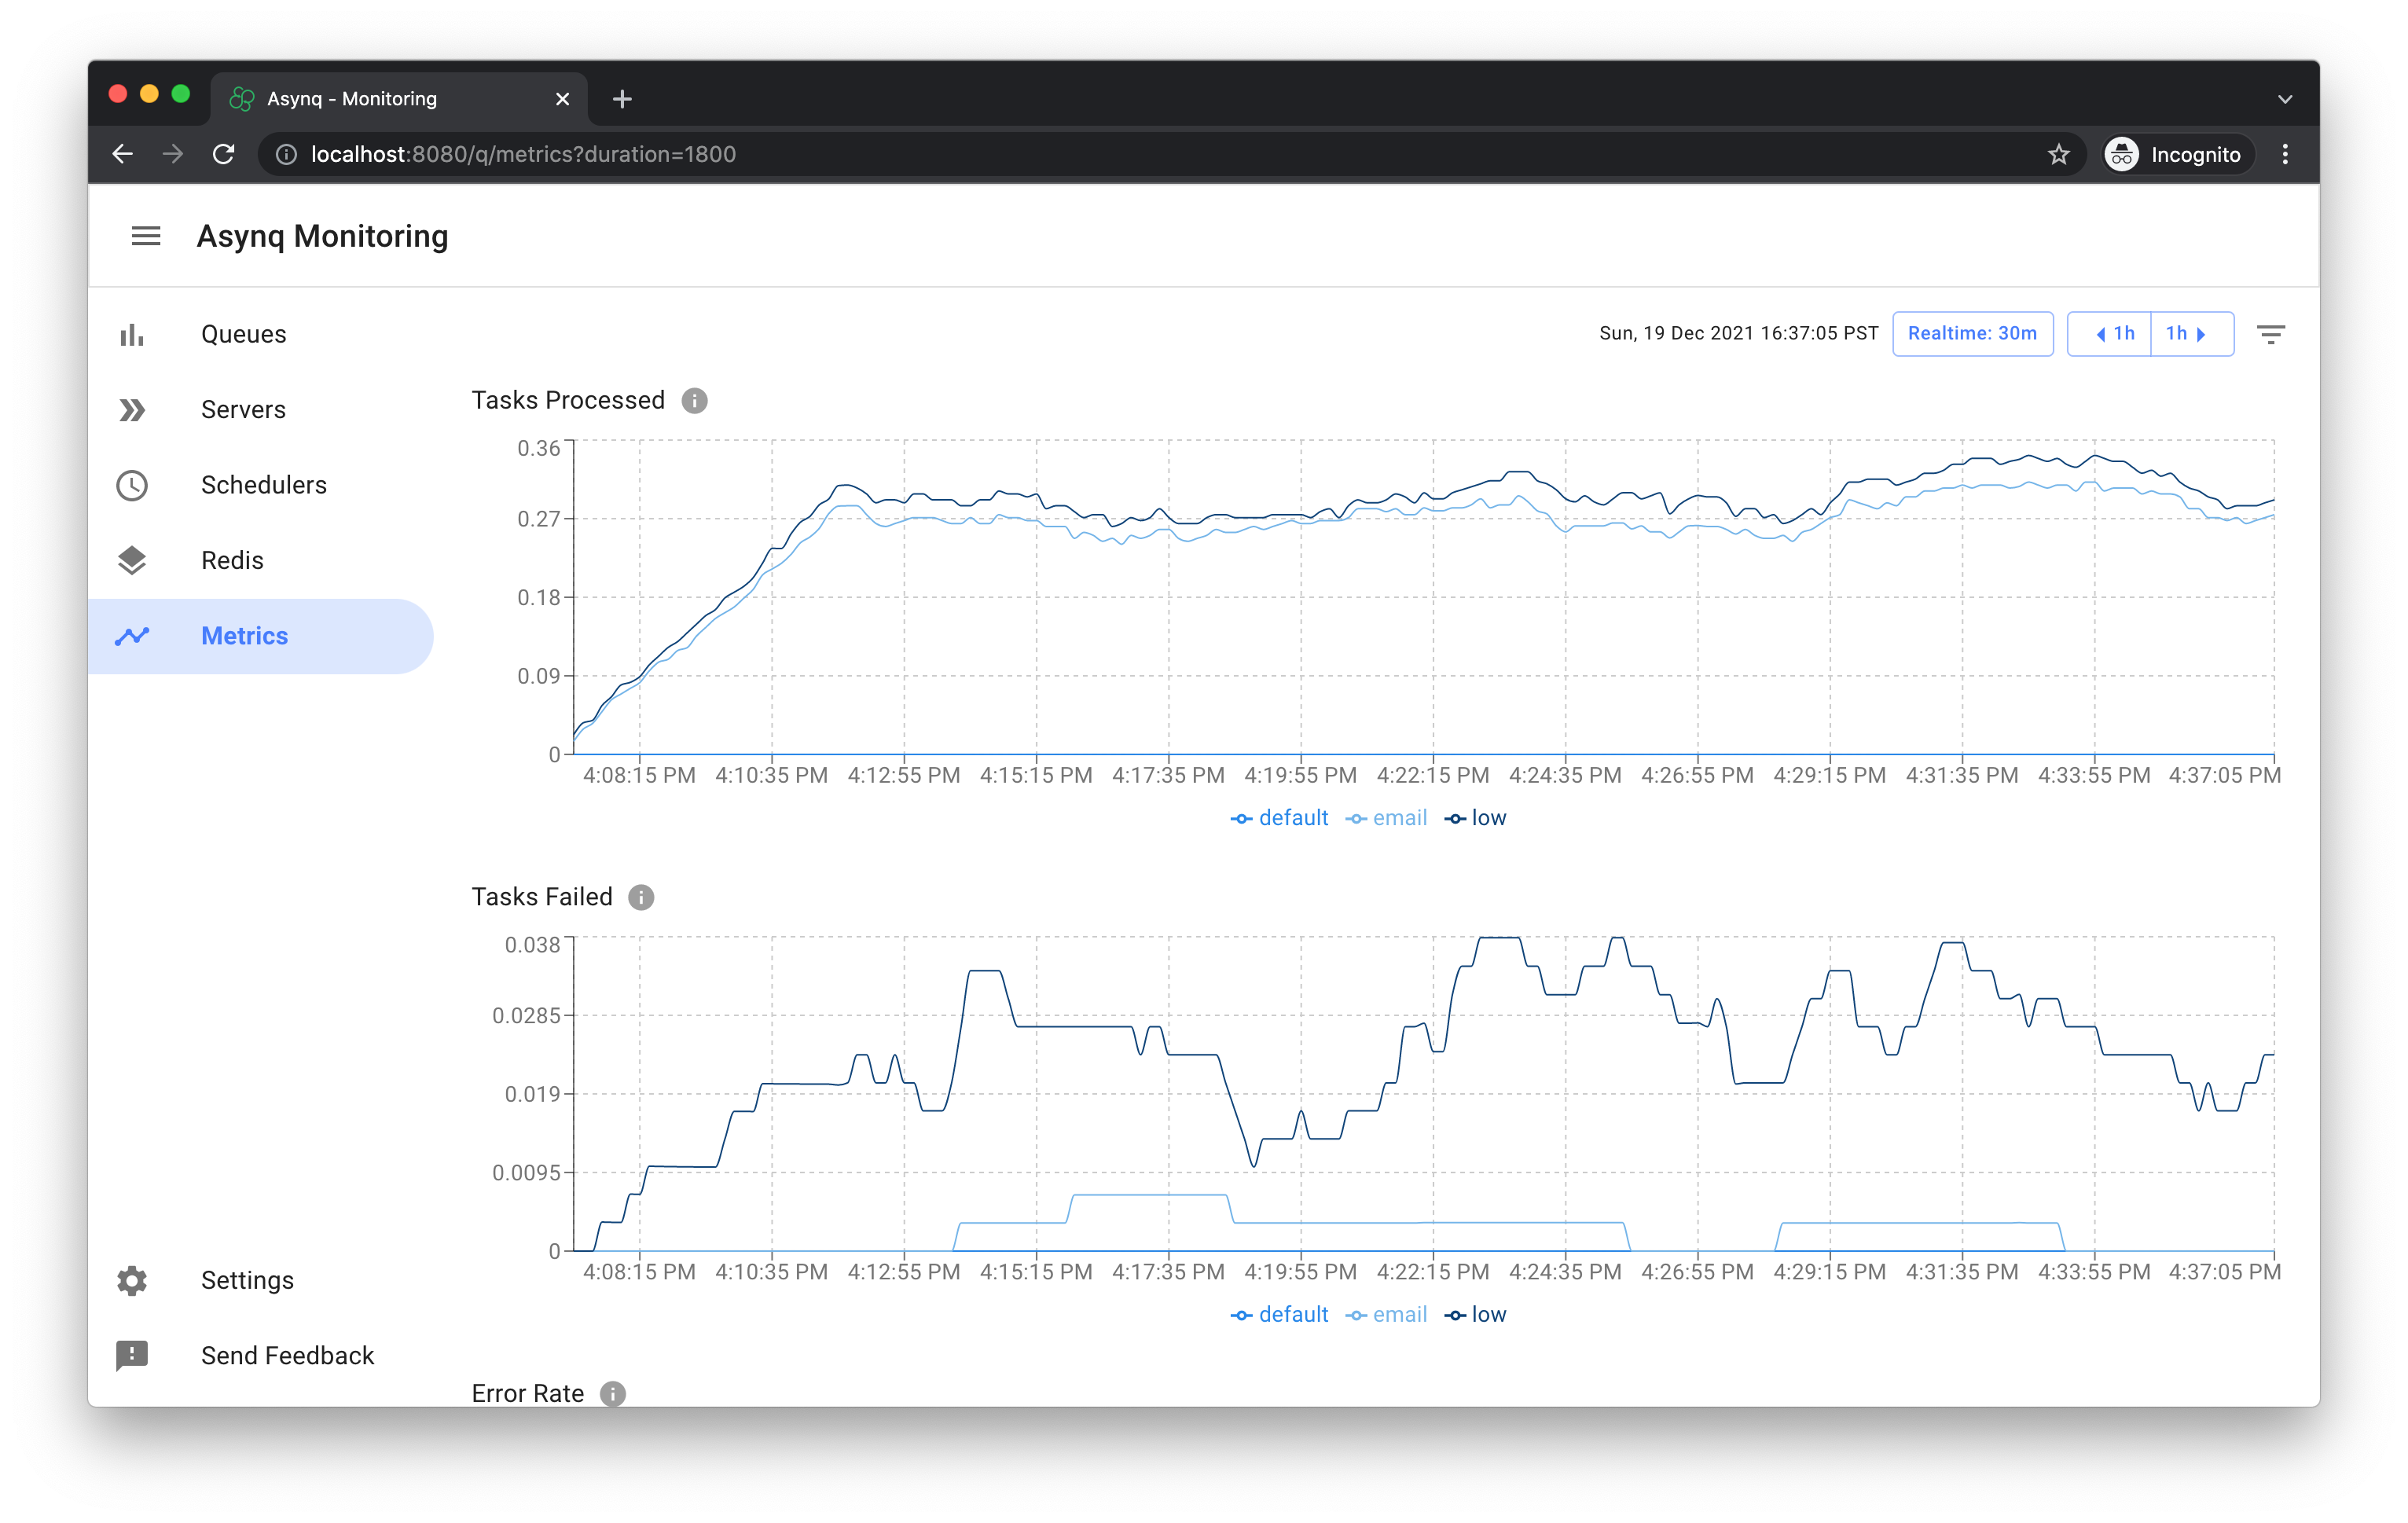
หน้าคิวแมตริกจะมีลักษณะดังนี้:
หากคุณไม่ได้ใช้งานหน้าจอ UI Asynq มาพร้อมกับไฟล์ไบนารีที่คุณสามารถเรียกใช้เพื่อส่งออกคิวแมตริก มันยังรวมถึงแพคเกจ x/metrics สำหรับการรวบรวมคิวแมตริก
คิวระบบกระบวนการ
ไอเท็มของ Asynq Handler และ ServeMux สามารถใช้เครื่องมือวัดการตั้งธุรกิจสำหรับการสังเกตการณ์
นี่คือตัวอย่างการส่งออกคิวระบบกระบวนการโดยใช้ Prometheus เราสามารถใช้เครื่องมือเข้าทำในโค้ดของเราในแอปพลิเคชันเพื่อติดตามคิวที่เฉพาะเจาะจงของแอปพลิเคชัน รวมถึงคิวที่ติดต่อ (เช่นหน่วยความจำและ CPU) ติดตามโดย Prometheus
นี่คือรายการของคิวที่เฉพาะเจาะจงของแอปพลิเคชันที่ติดตามในโค้ดตัวอย่าง:
- จำนวนรวมของงานที่ประมวลผลโดยกระบวนการงาน (รวมทั้งงานที่ประสบความสำเร็จและล้มเหลว).
- จำนวนของงานที่ล้มเหลวที่ประมวลผลโดยกระบวนการงาน.
- จำนวนปัจจุบันของงานที่กำลังถูกประมวลผลโดยกระบวนการงาน.
// โค้ดภาษา GO
package main

import (
    "context"
    "log"
    "net/http"
    "os"
    "os/signal"
    "runtime"

    "github.com/hibiken/asynq"
    "github.com/hibiken/asynq/examples/tasks"
    "github.com/prometheus/client_golang/prometheus"
    "github.com/prometheus/client_golang/prometheus/promauto"
    "github.com/prometheus/client_golang/prometheus/promhttp"
    "golang.org/x/sys/unix"
)

// ตัวแปรเมตริก
var (
    processedCounter = promauto.NewCounterVec(
        prometheus.CounterOpts{
            Name: "processed_tasks_total",
            Help: "จำนวนของงานที่ประมวลผลแบบรวม",
        },
        []string{"task_type"},
    )

    failedCounter = promauto.NewCounterVec(
        prometheus.CounterOpts{
            Name: "failed_tasks_total",
            Help: "จำนวนของงานที่ล้มเหลวที่ประมวลผลแบบรวม",
        },
        []string{"task_type"},
    )

    inProgressGauge = promauto.NewGaugeVec(
        prometheus.GaugeOpts{
            Name: "in_progress_tasks",
            Help: "จำนวนปัจจุบันของงานที่กำลังถูกประมวลผล",
        },
        []string{"task_type"},
    )
)

func metricsMiddleware(next asynq.Handler) asynq.Handler {
    return asynq.HandlerFunc(func(ctx context.Context, t *asynq.Task) error {
        inProgressGauge.WithLabelValues(t.Type()).Inc()
        err := next.ProcessTask(ctx, t)
        inProgressGauge.WithLabelValues(t.Type()).Dec()
        if err != nil {
            failedCounter.WithLabelValues(t.Type()).Inc()
        }
        processedCounter.WithLabelValues(t.Type()).Inc()
        return err
    })
}

func main() {
    httpServeMux := http.NewServeMux()
    httpServeMux.Handle("/metrics", promhttp.Handler())
    metricsSrv := &http.Server{
        Addr:    ":2112",
        Handler: httpServeMux,
    }
    done := make(chan struct{})

    // เริ่มเซิร์ฟเวอร์เมตริก
    go func() {
        err := metricsSrv.ListenAndServe()
        if err != nil && err != http.ErrServerClosed {
            log.Printf("Error: metrics server errored: %v", err)
        }
        close(done)
    }()

    srv := asynq.NewServer(
        asynq.RedisClientOpt{Addr: ":6379"},
        asynq.Config{Concurrency: 20},
    )

    mux := asynq.NewServeMux()
    mux.Use(metricsMiddleware)
    mux.HandleFunc(tasks.TypeEmail, tasks.HandleEmailTask)

    // เริ่มเซิร์ฟเวอร์เวิร์คเกอร์
    if err := srv.Start(mux); err != nil {
        log.Fatalf("Failed to start worker server: %v", err)
    }

    // รอสัญญาณการสิ้นสุด
    sigs := make(chan os.Signal, 1)
    signal.Notify(sigs, unix.SIGTERM, unix.SIGINT)
}