Real-time monitoring of Watermill using Prometheus
Metrics
Watermill can be monitored by using decorators for publishers/subscribers and middleware for handlers. We provide a default implementation using the official Prometheus client for Go.
The components/metrics package exports PrometheusMetricsBuilder, which provides convenient functions to wrap publishers, subscribers, and handlers to update the relevant Prometheus registry:
Full source code: github.com/ThreeDotsLabs/watermill/components/metrics/builder.go
// ...
// The PrometheusMetricsBuilder provides methods for decorating publishers, subscribers, and handlers.
type PrometheusMetricsBuilder struct {
    // PrometheusRegistry can fill in an existing Prometheus registry or be empty to use the default registry.
    PrometheusRegistry prometheus.Registerer

    Namespace string
    Subsystem string
}

// AddPrometheusRouterMetrics is a convenient function for adding metric middleware to all handlers on the message router. It also decorates the publishers and subscribers of the handlers.
func (b PrometheusMetricsBuilder) AddPrometheusRouterMetrics(r *message.Router) {
// ...
Wrapping Publishers, Subscribers, and Handlers
If you are using Watermill's router (which is recommended in most cases), you can use the convenient function AddPrometheusRouterMetrics to ensure that all handlers added to this router are wrapped to update the Prometheus registry, as well as their publishers and subscribers:
Full source code: github.com/ThreeDotsLabs/watermill/components/metrics/builder.go
// ...
// AddPrometheusRouterMetrics is a convenient function for adding metric middleware to all handlers on the message router. It also decorates the publishers and subscribers of the handlers.
func (b PrometheusMetricsBuilder) AddPrometheusRouterMetrics(r *message.Router) {
    r.AddPublisherDecorators(b.DecoratePublisher)
    r.AddSubscriberDecorators(b.DecorateSubscriber)
    r.AddMiddleware(b.NewRouterMiddleware().Middleware)
}
// ...
Example of using AddPrometheusRouterMetrics:
Full source code: github.com/ThreeDotsLabs/watermill/_examples/basic/4-metrics/main.go
// ...
    // We leave the namespace and subsystem empty
    metricsBuilder := metrics.NewPrometheusMetricsBuilder(prometheusRegistry, "", "")
    metricsBuilder.AddPrometheusRouterMetrics(router)
// ...
In the above code snippet, we leave the namespace and subsystem parameters empty. The Prometheus client library uses these parameters to prefix metric names. You may want to use namespace or subsystem, but please note that this will affect the metric names, so you need to adjust the Grafana dashboard accordingly.
Independent publishers and subscribers can also be decorated using dedicated methods of PrometheusMetricsBuilder:
Full source code: github.com/ThreeDotsLabs/watermill/_examples/basic/4-metrics/main.go
// ...
    subWithMetrics, err := metricsBuilder.DecorateSubscriber(pubSub)
    if err != nil {
        panic(err)
    }
    pubWithMetrics, err := metricsBuilder.DecoratePublisher(pub)
    if err != nil {
        panic(err)
    }
// ...
Expose /metrics Endpoint
According to the working principle of Prometheus, a service needs to expose an HTTP endpoint for data scraping. Conventionally, this is a GET endpoint, and the path is usually /metrics.
To provide this endpoint, there are two convenient functions available, one using the previously created Prometheus Registry and the other simultaneously creating a new Registry:
Complete source code: github.com/ThreeDotsLabs/watermill/components/metrics/http.go
// ...
// CreateRegistryAndServeHTTP establishes an HTTP server at the given address to expose the /metrics endpoint to Prometheus.
// It returns a new Prometheus Registry (for metric registration) and a cancellation function to shut down the server.
func CreateRegistryAndServeHTTP(addr string) (registry *prometheus.Registry, cancel func()) {
	registry = prometheus.NewRegistry()
	return registry, ServeHTTP(addr, registry)
}

// ServeHTTP establishes an HTTP server at the given address to expose the /metrics endpoint to Prometheus.
// It accepts an existing Prometheus Registry and returns a cancellation function to shut down the server.
func ServeHTTP(addr string, registry *prometheus.Registry) (cancel func()) {
// ...
Here's an example of usage:
Complete source code: github.com/ThreeDotsLabs/watermill/_examples/basic/4-metrics/main.go
// ...
	prometheusRegistry, closeMetricsServer := metrics.CreateRegistryAndServeHTTP(*metricsAddr)
	defer closeMetricsServer()

	// We leave the namespace and subsystem empty
	metricsBuilder := metrics.NewPrometheusMetricsBuilder(prometheusRegistry, "", "")
	metricsBuilder.AddPrometheusRouterMetrics(router)
// ...
Example Application
To understand how the dashboard works in practice, you can refer to the metrics example.
Follow the instructions in the example's README to run it and add the Prometheus data source to Grafana.
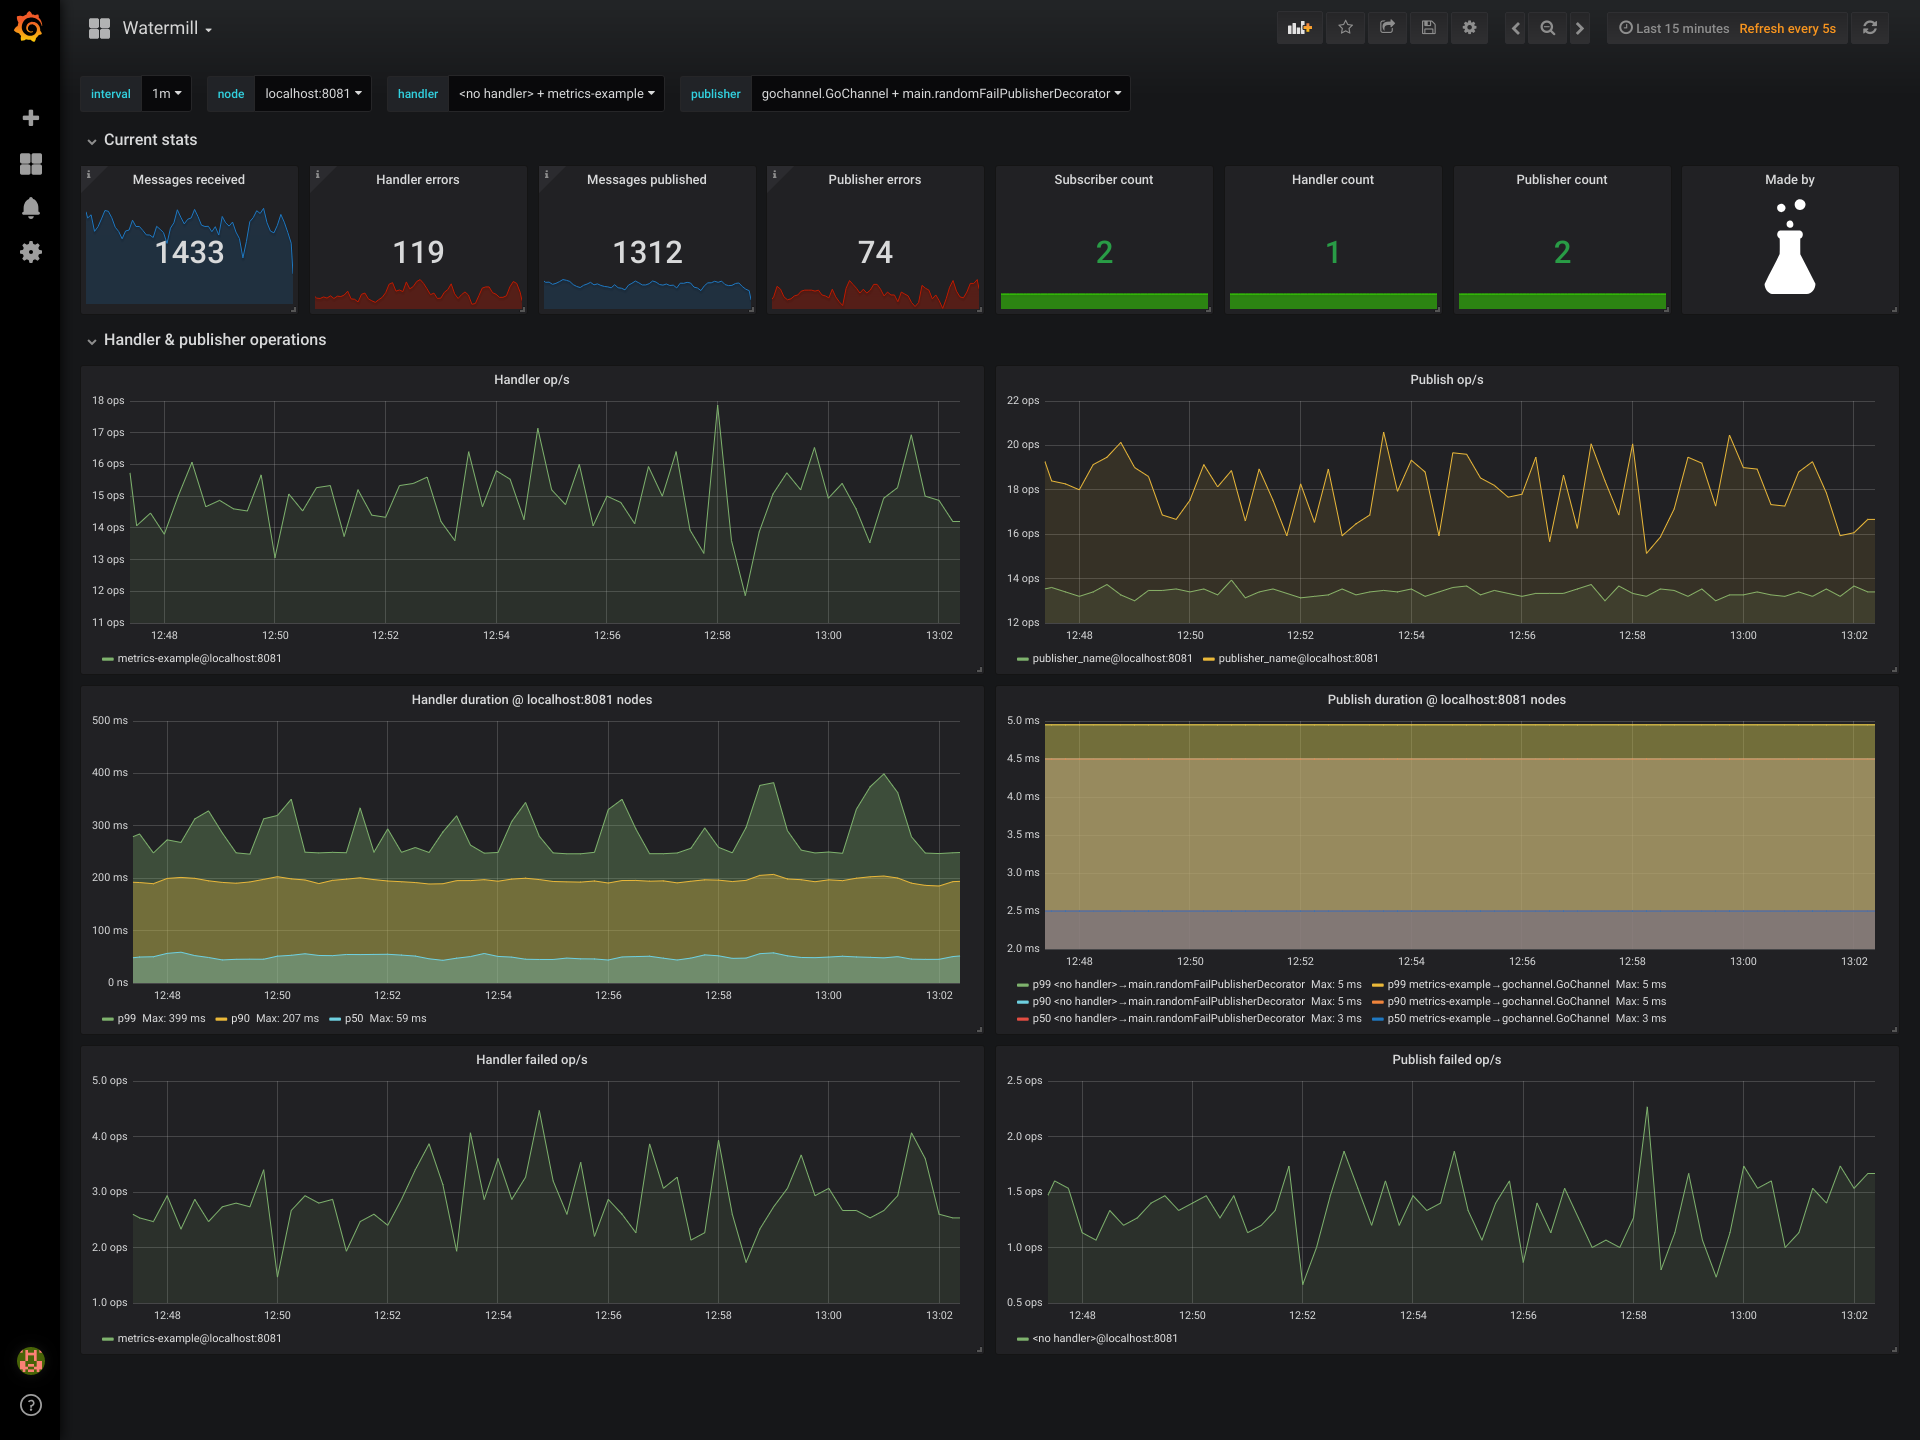
Grafana Dashboard
We have prepared a Grafana dashboard to use with the aforementioned metrics implementation. It provides basic information about throughput, failure rate, and publish/processing duration.
If you want to view this dashboard locally, you can use the example application.
For more information on the metrics exported to Prometheus, see Exported metrics.
Importing the Dashboard
To import the Grafana dashboard, select Dashboard/Manage from the left menu, then click +Import.
Enter the dashboard's URL https://grafana.com/dashboards/9777 (or just the ID, 9777), then click Load.
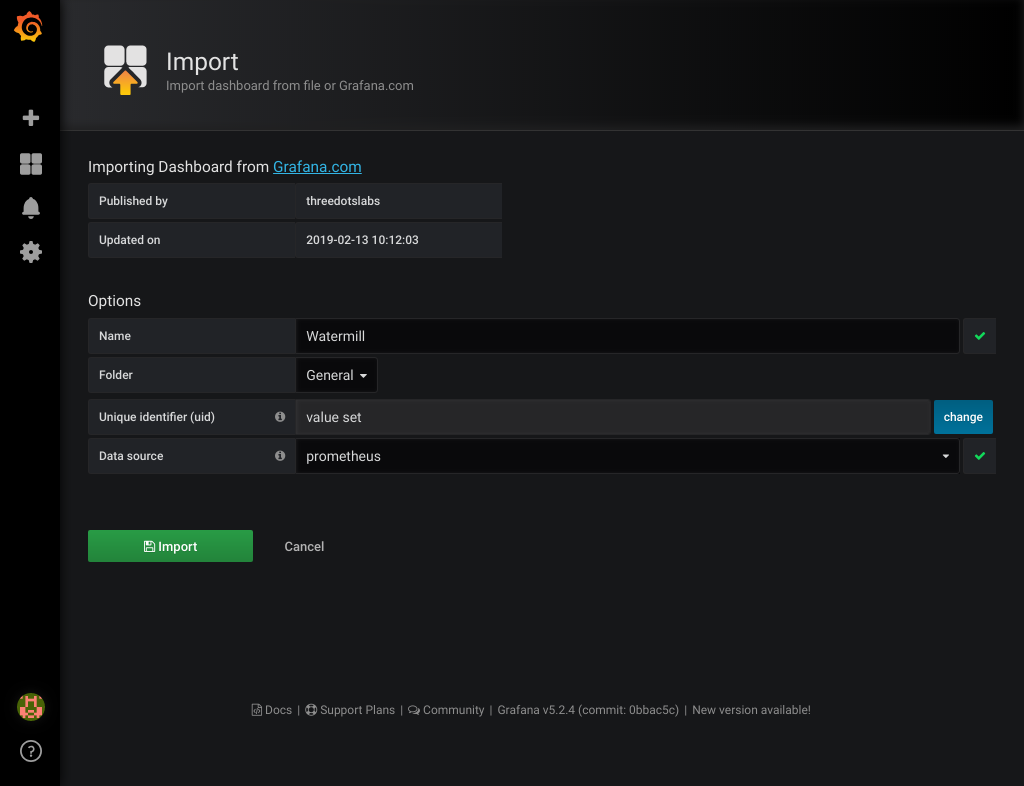
Then select the Prometheus data source used to scrape the /metrics endpoint. Click Import and you're done!
Exported Metrics
The following lists all the metrics registered in the Prometheus registry by PrometheusMetricsBuilder.
For more information on Prometheus metric types, please refer to the Prometheus documentation.
| Object | Metric | Description | Labels/Values |
|---|---|---|---|
| Subscriber | subscriber_messages_received_total |
A Prometheus counter. Counts the number of messages received by a subscriber. | acked is "acked" or "nacked". |
If the subscriber operates within a handler, set handler_name; otherwise, " |
|||
subscriber_name identifies the subscriber. If it implements the fmt.Stringer interface, it is the result of String(); otherwise, it is package.structName. |
|||
| Handler | handler_execution_time_seconds |
A Prometheus histogram. Records the execution time of the handler function wrapped by the middleware. | handler_name is the name of the handler. |
success is "true" or "false", depending on whether the wrapped handler function returns an error. |
|||
| Publisher | publish_time_seconds |
A Prometheus histogram. Records the execution time of the decorated publish function of the publisher. | success is "true" or "false", depending on whether the decorated publisher returns an error. |
If the publisher operates within a handler, set handler_name; otherwise, " |
|||
publisher_name identifies the publisher. If it implements the fmt.Stringer interface, it is the result of String(); otherwise, it is package.structName. |
Additionally, each metric has a node label provided by Prometheus, with its value corresponding to the instance of the metric source, and a job specified as the job name in the Prometheus configuration file.
Note: As mentioned above, using a non-empty namespace or subsystem will result in a metric name prefix. You may need to make corresponding adjustments, such as in the panel definition of a Grafana dashboard.
Customization
If you believe that a certain metric has been overlooked, you can easily extend this basic implementation. The best way is to use the Prometheus registry used with the ServeHTTP method and register the metrics according to the documentation of the Prometheus client here.
A concise method to update these metrics is by using decorators. The full source code can be found at github.com/ThreeDotsLabs/watermill/message/decorator.go.
// ...
// MessageTransformSubscriberDecorator creates a subscriber decorator that calls the transform function on each message passed through the subscriber.
func MessageTransformSubscriberDecorator(transform func(*Message)) SubscriberDecorator {
	if transform == nil {
		panic("transform function is nil")
	}
	return func(sub Subscriber) (Subscriber, error) {
		return &messageTransformSubscriberDecorator{
			sub:       sub,
			transform: transform,
		}, nil
	}
}

// MessageTransformPublisherDecorator creates a publisher decorator that calls the transform function on each message passed through the publisher.
func MessageTransformPublisherDecorator(transform func(*Message)) PublisherDecorator {
	if transform == nil {
		panic("transform function is nil")
	}
	return func(pub Publisher) (Publisher, error) {
		return &messageTransformPublisherDecorator{
			Publisher: pub,
			transform: transform,
		}, nil
	}
}

type messageTransformSubscriberDecorator struct {
// ...
And/or middleware in routers.
A simpler method is to update the required metrics only in the handler functions.